Teaching machines to see like radiologists
How Claude Opus found a spinal lesion by reasoning from clinical knowledge alone
MAY 10, 2026
⚠️ Early experimental findings from our research. Not a clinical product, not a peer-reviewed study. All experiments used publicly available imaging data, and the work is still in progress.
📖 New to radiology? A radiologist reads medical scans and writes a report describing what they see. A lumbar spine MRI is a scan of the lower back. MRIs are captured in different "sequences" (T1-weighted, T2-weighted, etc.) that highlight tissue differently, so the same anatomy looks different on each. Today's radiology AI mostly detects one specific finding at a time (a brain bleed, a lung nodule); this post asks whether a general-purpose AI can read a scan more like a radiologist does, reasoning from image pattern descriptions and inference across multimodal data rather than from thousands of labeled examples of one finding.
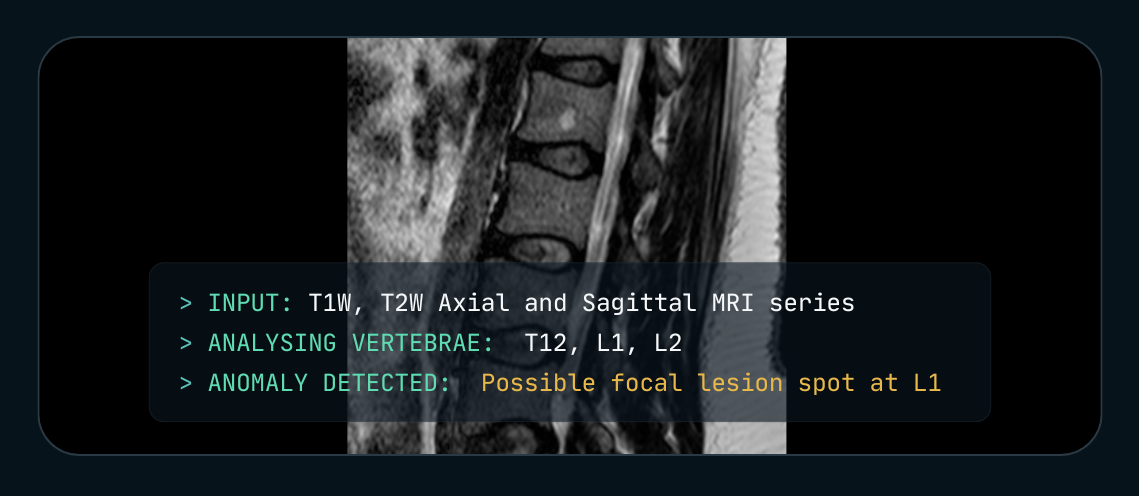
We asked Claude Opus to read a lumbar spine MRI. With a generic "act as a radiologist" prompt, it produced a confident-sounding report. It missed a small vertebral hemangioma at L1 and hallucinated a stenosis that wasn't there. Same model, same scan, but with a textbook-style description of the finding and a step-by-step reasoning prompt that we built up across a handful of experiments, Claude Opus found the lesion. No fine-tuning. No labeled medical dataset.
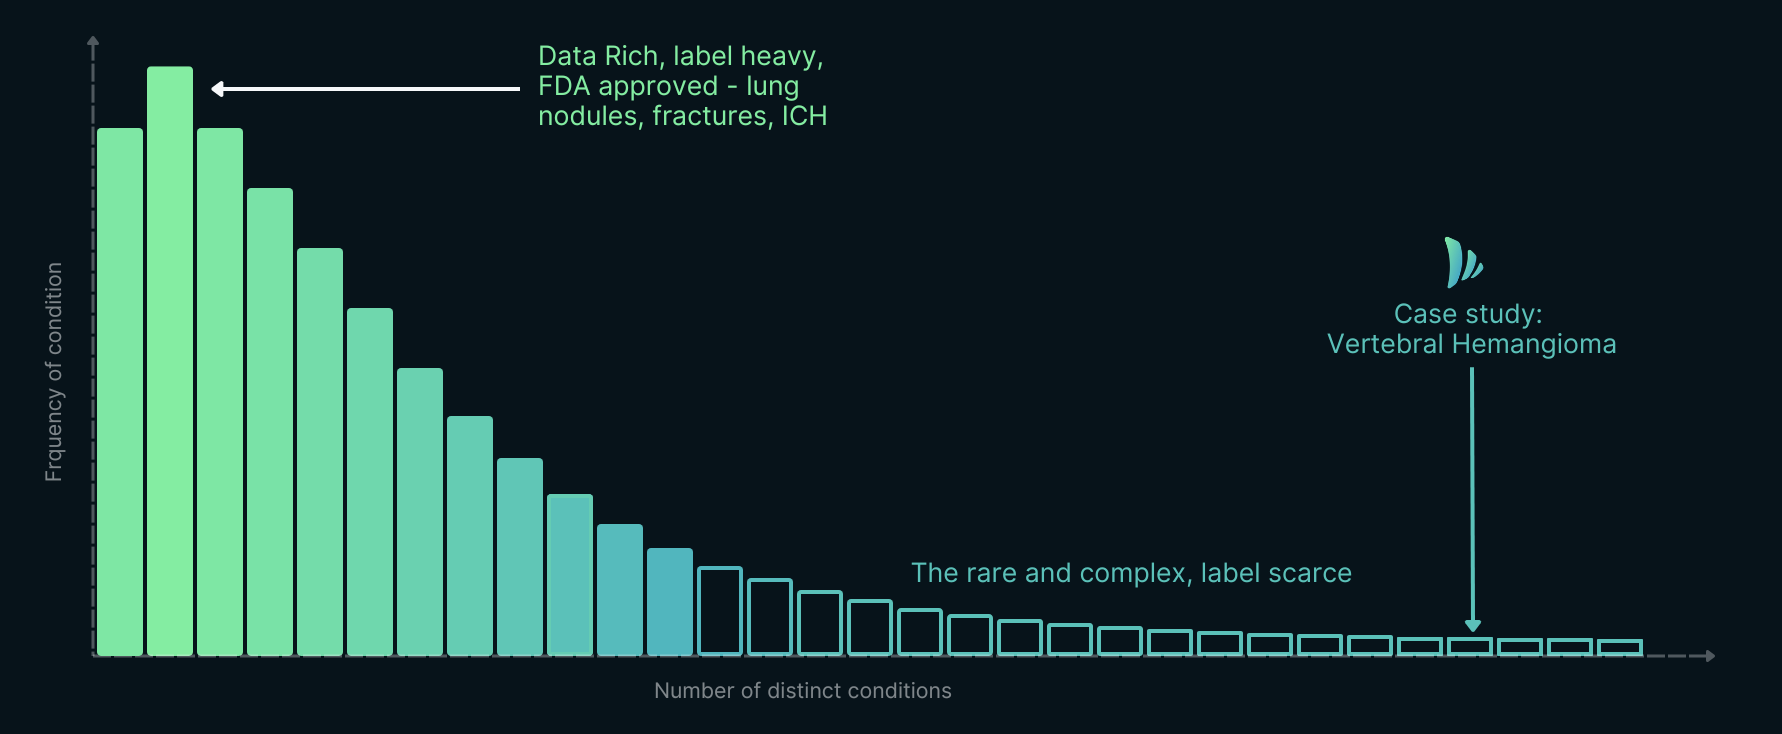
The long tail of radiology AI. Most diagnostic findings are rare, complex, and label-scarce, including vertebral hemangioma, the focus of this case study.
What changed between failure and success was not data or model size. It was the way clinical knowledge was encoded in the prompt. If that observation holds up under harder testing, it suggests a different path for the long tail of radiology findings: the hundreds of conditions radiologists are trained to recognize, but for which no one may ever assemble thousands of labeled examples.
We wanted to test a different approach: instead of training AI on thousands of labeled scans, what if you taught it to reason from clinical knowledge, the way a radiologist learns from a textbook? Here's what happened.
| "Give me a report" | "The Differential" | |
|---|---|---|
| The prompt | "You're an expert radiologist. Analyze these MRI images and write a detailed report. Focus on disc degeneration, stenosis, alignment, focal lesions, marrow changes." | A reference guide on MRI signal characteristics, a step-by-step chain of thought about anatomy and visual characteristics of anomalies. |
| What the model does | Skims the scan. Produces a confident-sounding report. No method. | Steps through each vertebra T12 to S1. Compares signal at each level. Flags L1 as brighter than its neighbors on T1W. |
| What you get | Misses the L1 hemangioma. Over-diagnoses canal narrowing and disc degeneration. | Finds the L1 hemangioma. Matches the radiologist's ground truth. |
This is an early example from our team's research at GRAI (Generalist Radiology AI), exploring whether clinical knowledge can be transferred to foundation models at inference time through language-guided prompting, as a potential approach to extend intelligent assistance to the long tail of pathology where large annotated datasets are scarce or non-existent.
Why that observation matters depends on where radiology AI sits today.
A field that has more tools than it can use
Radiology is, by some measures, the most AI-saturated specialty in medicine. Over 1,100 FDA-cleared AI tools exist for medical imaging.2 And yet, walk into a hospital reading room and the gap is striking: clinical adoption remains concentrated on fewer than a dozen conditions, mostly lung nodules, intracranial hemorrhage, and fracture detection.3 4
Each approved tool detects a single condition.
A single lumbar spine MRI requires assessment of dozens of potential findings on its own: disc pathology, spinal stenosis, vertebral lesions, nerve root compression, incidental extraspinal findings.5 Across all imaging modalities, radiologists must maintain expertise in thousands of diagnostic patterns.6 The arithmetic doesn't work. Each new FDA-cleared finding takes years of dataset collection, training, validation, and regulatory review. After more than a decade of that work, the field has covered roughly twelve. The remaining hundreds will not be reached one detector at a time.
So how did we get here, with so much capability on paper and so little of it covering what radiologists actually do? The answer runs through three eras of computer vision, each of which made a different bet about how machines should learn to see.
01: Classical computer vision: you could only find what you could describe mathematically
For 50 years, computer vision had one rule: if you couldn't write the equation, the computer couldn't see it.
Engineers hand-coded explicit mathematical rules for everything. Want to find edges? Apply a Sobel operator7 (1968), a 3×3 filter that measures how sharply pixel brightness changes. Dark-to-light jump? Mark it as an edge.
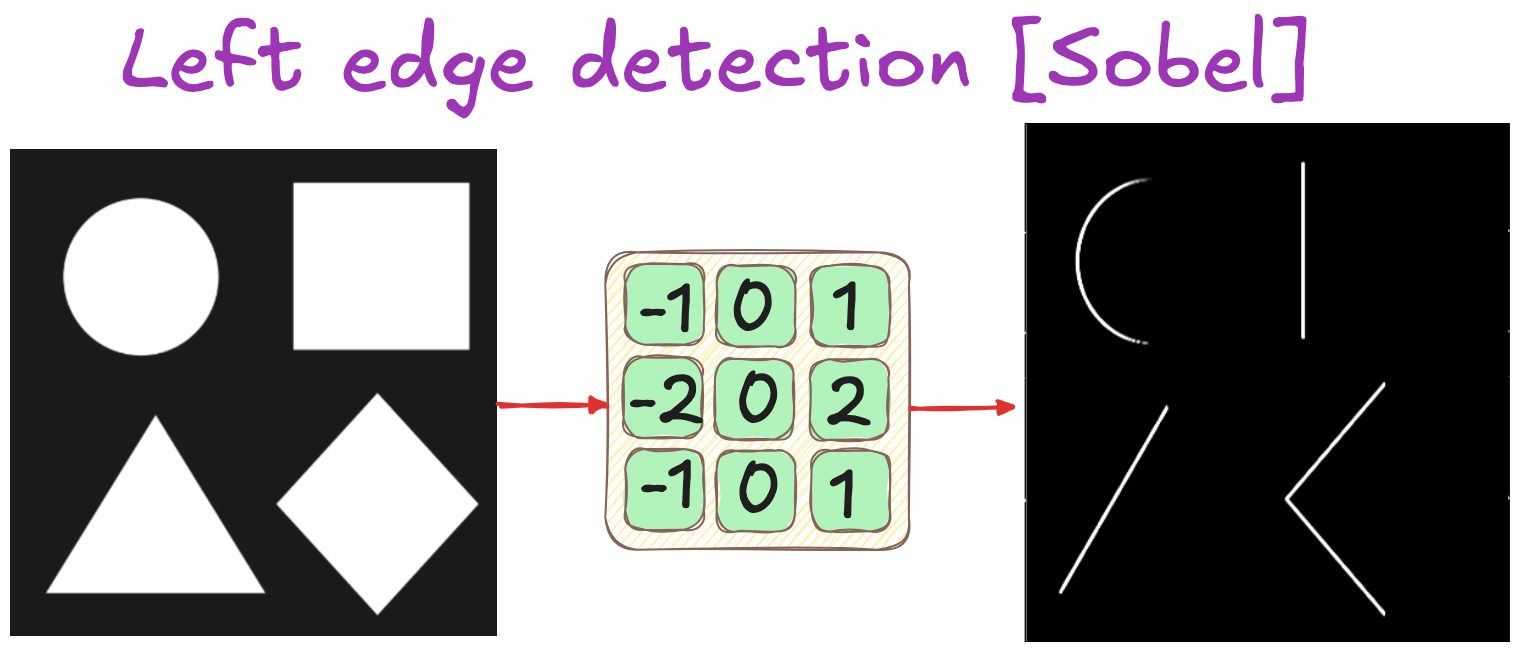
Sobel left edge detection kernel applied to simple geometric shapes. The 3×3 filter highlights vertical boundaries by measuring horizontal brightness change
The problem wasn't accuracy. Sobel or Canny filters are still optimal for edge detection. The problem was generalization: each new visual task required a new hand-crafted algorithm, often taking years to develop.
Early medical CAD systems could detect mammographic calcifications, which are bright, round, and mathematically simple,10 but struggled with soft tissue masses, which are irregular and context-dependent.11 Every pathology needed its own custom filters.
The fundamental limit. You could only detect what you already knew how to describe in closed-form mathematics. Classical computer vision was bottlenecked by human articulacy.
02: The CNN revolution: learning to see from examples
Then, in 2012, everything changed.
The ImageNet competition that year marked a turning point. AlexNet12, a deep convolutional neural network, cut image classification error nearly in half. The breakthrough wasn't algorithmic cleverness. It was scale: 1.2 million labeled images across 1,000 categories.13
The paradigm shift was simple: show a network 1,000 photos of cats, and it learns to detect the 1,001st. No one programs "cat detectors." The network discovers the pattern from examples.
What researchers found when they looked inside:
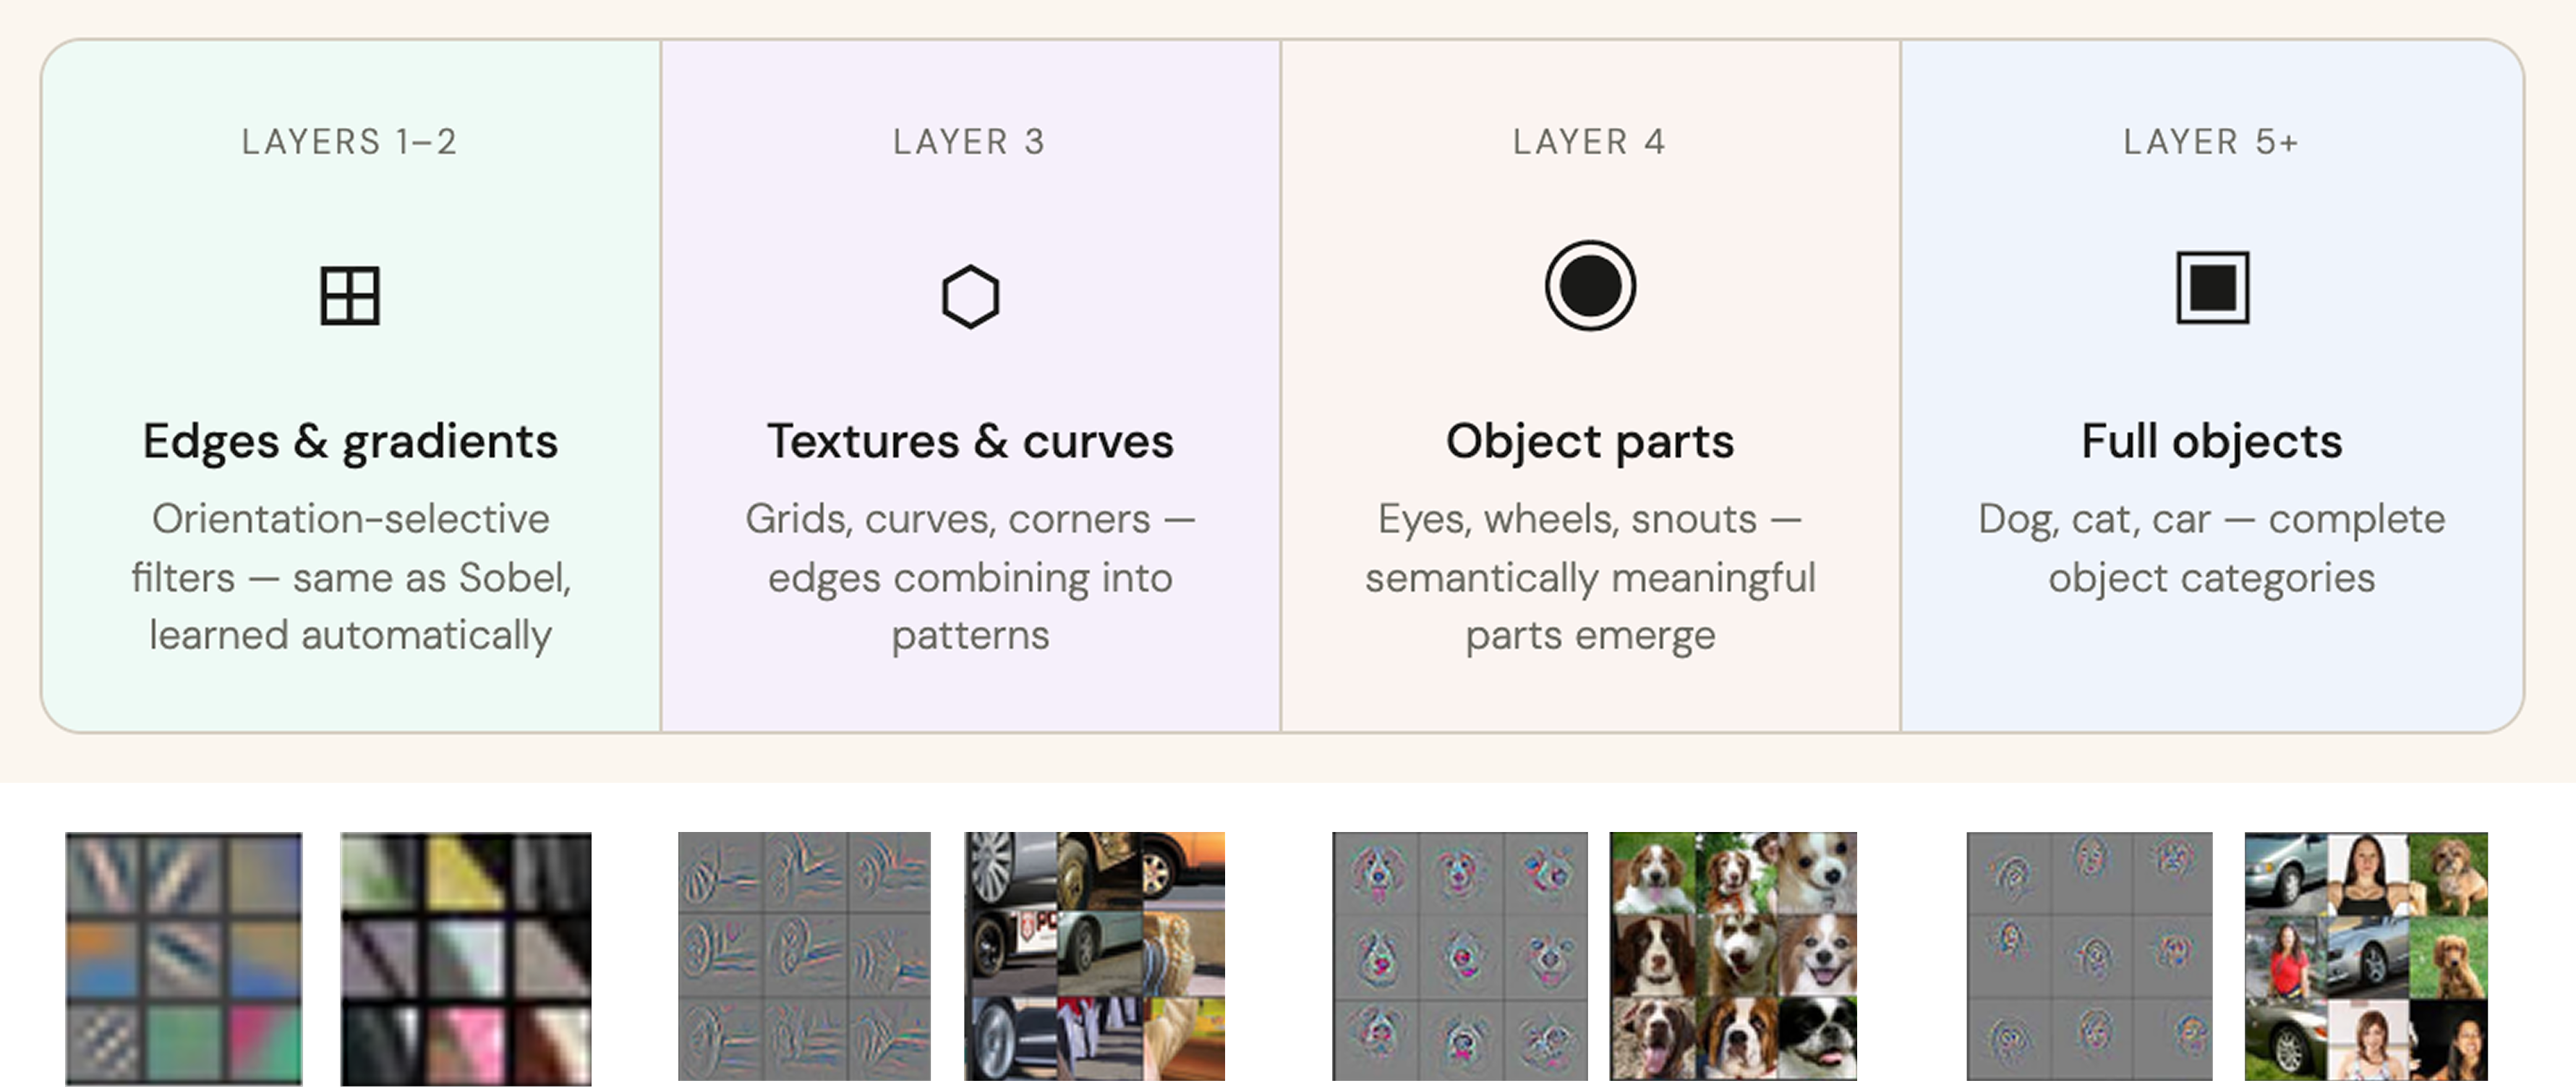
How CNN features compose across layers, Zeiler & Fergus.
When Zeiler & Fergus14 visualized trained networks in 2013, they discovered something remarkable. Nobody had told the network how to build hierarchical features, but it had anyway:
- Layer 1: Edge detectors (rediscovered Sobel-like filters)
- Layer 2: Texture patterns (corners, curves, grids)
- Layer 3: Object parts (eyes, ears, wheels)
- Layer 4: Complete objects (cat faces, car bodies)
The network had reverse-engineered classical computer vision's hierarchy, entirely from labeled examples. No mathematical formulas. No hand-coded rules. Just: here are cats, here are not-cats, figure it out.
The key: enough labeled examples.
The CNN wave delivered real clinical wins.
03: Point solutions at scale
CNNs delivered measurable clinical wins: Aidoc's ICH detector (82% sensitivity across 101,944 head CTs)15 and Qure.ai's chest X-ray solution (96% sensitivity for pneumothorax)16 save lives in emergency settings.
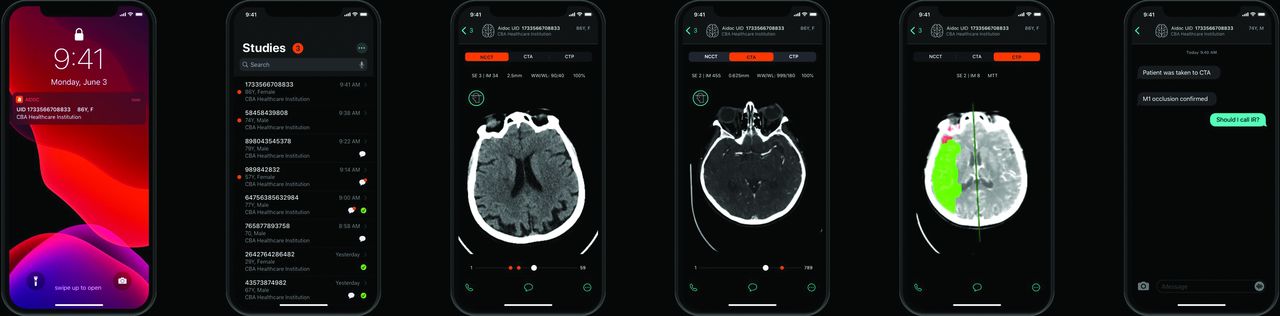
Aidoc's intracranial hemorrhage detection triages urgent cases and highlights suspected bleeds for radiologist review.
The coverage gap:
After seven years of development, FDA-cleared chest X-ray tools cover approximately 8 to 10 specific findings.16 17 35 Radiologists, by contrast, must recognize more than 100 distinct findings,17 18 19 requiring hundreds of chest X-rays to develop diagnostic confidence,18 mastery of 23+ disease patterns,20 and recognition of 24+ classical radiological signs.21
| Pathology | FDA-cleared AI tools | Clinical characteristics |
|---|---|---|
| HIGH AI COVERAGE: | ||
| Lung nodules | Multiple tools | Well-defined round opacities; high priority for cancer screening |
| Pneumothorax | Multiple tools | Time-critical emergency; collapsed lung with visible air |
| Intracranial hemorrhage (CT) | 15+ tools15 | Acute bleeding in brain; life-threatening emergency |
| ZERO AI COVERAGE: | ||
| Interstitial lung disease | 0 tools | Fine reticular patterns; requires distinguishing scarring, fluid, and infection |
| Mediastinal masses | 0 tools | Chest tumors requiring differential diagnosis based on location, shape, and patient age |
| Vertebral hemangioma | 0 tools | Benign bone lesion; 10-41% prevalence;22 23 must be distinguished from cancer metastases |
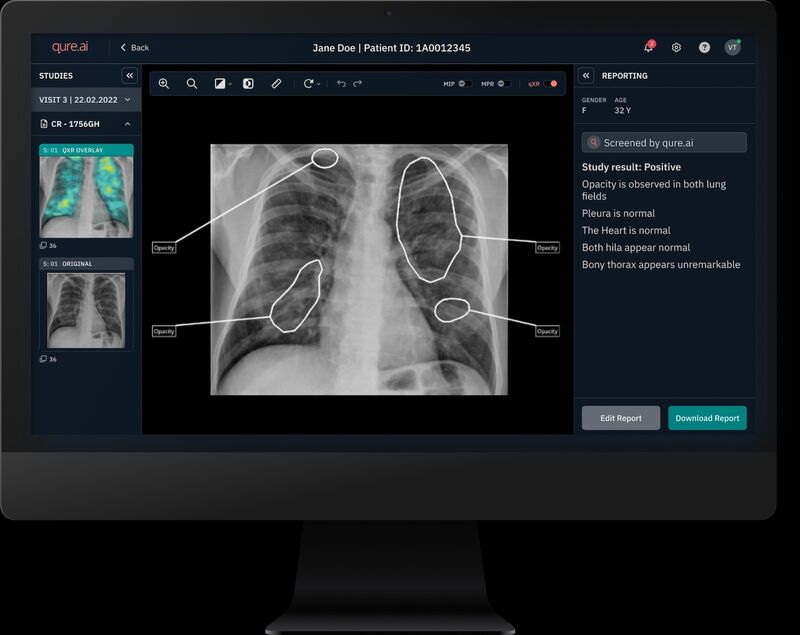
Qure.ai's chest X-ray AI flags regions of interest with bounding boxes; radiologists review each finding and generate the final diagnostic report.
After seven years and billions invested, coverage remains concentrated on roughly a dozen high-prevalence conditions. Fifteen companies competing to detect ICH. Zero addressing the hundreds of rare findings that fill radiology textbooks. These are the findings where AI could help radiologists the most, and where it currently helps the least.
The question became: can you build AI that works alongside radiologists, reasoning through images the way they do, guided by clinical knowledge encoded in language rather than requiring labeled pixels for every finding?
04: The commercialization wave
The research community has validated the concept: VLMs generating chest X-ray reports (XrayGPT, MedXChat)24 25 and performing zero-shot medical diagnosis.26 GPT-4V's 12-25% accuracy on chest radiographs27 28 is too low for clinical use, but few-shot learning and prompt engineering improve performance significantly.29 30 The bottleneck isn't model capability, it's knowledge transfer methodology.
What's already in place for language-guided medical AI.
- Foundation models Image understanding at scale, multimodal SAM CLIP
- Frontier VLMs Visual reasoning capability Claude Opus GPT-5
- Medical datasets For X-ray (public, growing) MIMIC-CXR NIH ChestX-ray CT / MR datasets limited; private access matters.
- Prompt engineering Chain-of-thought and few-shot learning, proven effective.
Most large medical imaging datasets remain locked in hospital systems. But VLMs shift the competitive advantage: instead of racing to annotate millions of private scans, the path is capturing clinical reasoning from textbooks and encoding it in prompts. Foundation models already understand visual patterns from billions of images, and the missing piece is translating radiological knowledge into language they can apply.
The commercialization wave is beginning. The question is no longer if language-guided medical AI works, it's how to build it for clinical reliability.
Here's what we learned from testing that hypothesis.
05: The hypothesis: reasoning from textbook knowledge
Vision-language models, by contrast, are trained on enormous corpora of images and learn to reason about what they see. Where the CNN approach demands a separate model and a separate dataset for each new abnormality, a VLM is task-agnostic. Even without fine-tuning for a specific case, it can take a textbook description of what a hemangioma looks like and why, reason through the visual pattern, and apply that knowledge to a scan at inference time. This distinction matters for medicine because it means extending the model to new conditions with fewer examples, the same way a radiology textbook extends a clinician's capability without requiring thousands of cases.
💡 The test case: vertebral hemangioma
Why it's a useful test:
- Learned from a textbook description.
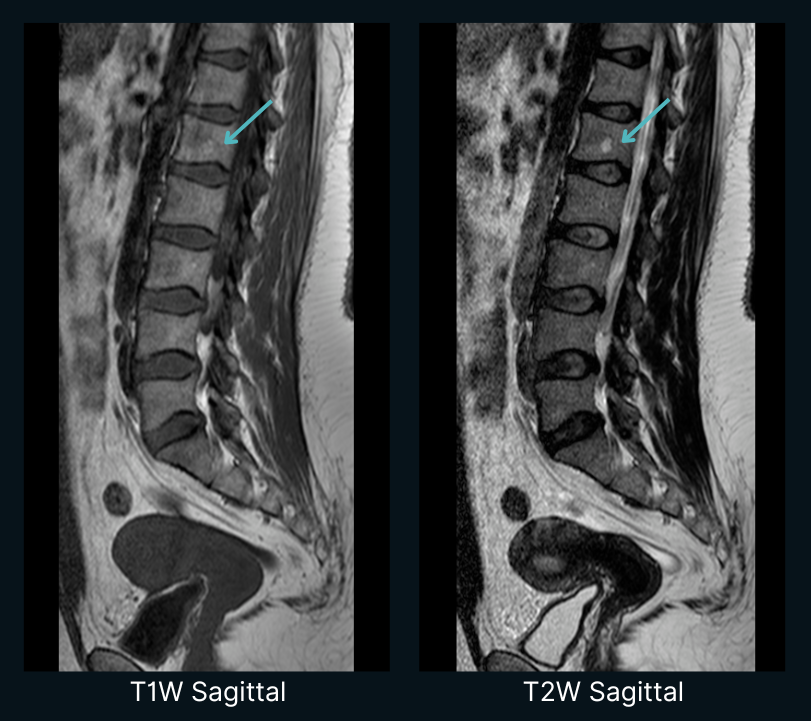
- Clear visual signature: bright on T1-weighted MRI (fat content).
- Small, focal, well-defined, easy to miss.
- Clinically insignificant in most cases (benign).
We used a publicly available lumbar spine MRI from the Kaggle Spinal Cord MRI Dataset: a 32-year-old female patient with lumbar and sacrococcygeal pain. The companion notebook1 works with four sequences from her study (T1W sagittal, T2W sagittal, STIR sagittal, T2W axial), 47 DICOM files in total. An expert radiologist's ground-truth report identified a 0.6 x 0.9 cm focal lesion at L1 consistent with vertebral hemangioma.
The question: can Claude Opus find it using only textbook descriptions and the scan itself, with no fine-tuning and no medical imaging training data?
06: Six experiments: the discovery
We ran six experiments against the same scan. Each one varied a single ingredient of the prompt: how much data the model saw, whether the prompt named the finding, whether multiple sequences were available, and whether the model had a structured reference to reason from. Every cached response is in the companion notebook1 so a reader can re-execute or modify any of them.
Experiment 1: the baseline failure
We sent Claude Opus four representative mid-slices (T2W sagittal, T1W sagittal, STIR sagittal, T2W axial) with a generic radiology prompt:
You are an expert radiologist. Analyze these lumbar spine MRI images and generate a detailed radiology report.
Focus on: disc degeneration, herniations, bulging, stenosis, alignment, focal lesions, bone marrow changes.
Claude produced a polished, four-section report. It listed multilevel disc degeneration at L3-L4, L4-L5, and L5-S1. It flagged "mild central canal narrowing at L4-L5." The L1 marrow was described as "homogeneous." The hemangioma was not mentioned. Several findings were over-diagnosed beyond what the radiologist's ground-truth report supports.
Takeaway. Generic medical prompts produce plausible-sounding radiology text without the diagnostic depth to back it up. The model writes like a radiologist; it does not yet read like one.
Experiment 2: can Claude see it at all?
Before adding more complexity, we tested a simpler question: can Claude actually perceive the brightness difference that indicates a hemangioma?
We flipped the experiment. Instead of asking Claude to find pathology, we gave it the ground-truth report and asked it to locate each finding in the image, a reverse test:
A radiologist has already reported the following findings:
1. Smoothed lumbar lordosis
2. L1 vertebral body, focal lesion (hemangioma), 0.6 x 0.9 cm; should appear as a BRIGHT SPOT on T1
3. L5-S1 disc height reduced
4. Dorsal bulging of L3-S1 discs

Look at this T1-weighted slice and tell me where each finding is. Be very specific about what you SEE.
Claude located every finding immediately, with spatial detail. On L1: "there is a focal hyperintense (bright) round lesion located in the central-to-posterior portion of the vertebral body. The lesion measures approximately 0.6 x 0.9 cm and stands out clearly against the slightly darker background of the normal vertebral marrow." Smoothed lordosis, L5-S1 disc height, posterior bulging - all located on the image.
Takeaway. Claude's visual capability was present from the start. The model was not failing in Experiment 1 because it could not see; it was failing because it did not know what to look for.
Experiments 3 to 5: each lever, on its own, is not enough
The next three experiments each changed one variable, holding the rest constant.
Experiment 3, more data. Same generic prompt as Experiment 1, but the input expanded from a single mid-slice to the full T1W series of 12 sagittal slices. Claude found a focal T1-hyperintense lesion this time and called it a vertebral hemangioma. It placed it at L2, one level below the ground truth at L1.
Experiment 4, pattern descriptions without condition names. A single T1W mid-slice, but the prompt no longer says "look for hemangiomas." It says "look for a small, round, bright (hyperintense) focal spot inside any vertebral body." The model returned: "No clear pathologic focal hyperintensity identified... The marrow signal appears relatively homogeneous across the lumbar levels." A clean pattern description, on its own, did not surface the lesion.
Experiment 5, multi-modal. Twelve T1W slices plus twelve T2W slices, generic prompt. Claude flagged a focal hyperintense lesion bright on both T1W and T2W, the classic hemangioma signature. It placed it at L3, two levels off.
Each individual lever moved the needle in some way. More data surfaced a bright spot. Multi-modal context confirmed the cross-sequence signature. Pattern-only prompting removed any disease-name leak. None of them, alone, produced the right answer.
Experiment 6: the full scaffold
Experiment 6 combines everything into one prompt:
- A reference guide on MRI signal characteristics and pathology patterns drawn from radiology literature.31 32 What hemangiomas look like on T1 and T2 and why (fatty stroma, slow-flow vascular components). Anatomical landmarks for orientation (T12 has rib articulation, the lumbar bodies are L1 to L5, the conus medullaris terminates around L1).
- A chain-of-thought structure33 that walks the model through the scan in seven steps: identify the vertebrae, compare signal at each level on T1W, assess alignment, then discs, margins, facets, and other structures. Each step is asked to state its findings before moving on.
- A worked example, adapted from Radiopaedia,34 showing what a correct hemangioma description looks like at the right level of spatial detail.
Inputs were the same 24 images as Experiment 5. Same model. Same scan.
The model produced a step-by-step report. At Step 2 it compared L1 to T12 on T1W and flagged L1 as appearing brighter than its neighbors. It cross-checked on T2W, called the lesion at approximately 1 cm and well-defined, and finished with a structured impression listing the L1 hemangioma alongside the smoothed lordosis and the L5-S1 disc bulge, matching the load-bearing findings of the radiologist's report. Confidence on the L1 hemangioma: 90%.
Here is the full run, end to end:
Zero-shot: the model was not fine-tuned on spine MRI examples. It reasons from description alone.
Vertebral Identification
Signal Comparison on T1W
Alignment
Disc Assessment on T2W
Other levels well-preserved (expected for a 32-year-old).
- 1 L1 vertebral hemangioma, benign incidental finding, classic appearance, no aggressive features. 90%
- 2 Smoothed/flattened lumbar lordosis, likely reflecting muscle spasm. 85%
- 3 Mild L5-S1 disc degeneration with small posterior disc bulge, Pfirrmann grade III. 80%
What Claude Opus found (a spinal lesion) by reasoning from clinical knowledge alone.
This output came from Claude Opus 4.7, a general-purpose multimodal model rather than a radiology-specific system.
Takeaway. What changed across all six runs was not the model's visual capability. That was already there from Experiment 2. What changed was how we encoded clinical knowledge into the prompt. The reference guide told the model what to look for and why. The chain of thought forced a systematic walk through the scan instead of a generic summary. The worked example showed what the right level of spatial detail looks like. Together, those three pieces moved the model from missing the lesion to landing it.
07: What this means: knowledge vs. patterns
Reasoning across patterns and sequences.
Radiologists are not trained to recognize a thousand individual conditions one at a time. They are trained to read images, reasoning from imaging physics and biology: bright on T1 means fat, bright on T2 means water, round margins suggest benign, irregular margins suggest aggressive. A textbook does not enumerate every finding pixel by pixel. It teaches a way of looking.
A VLM can be guided the same way. It already brings pattern recognition from billions of natural images; what it lacks is the radiologist's reasoning about why a pattern means what it means. That reasoning lives in textbooks and case files, and it can be transferred at inference time through a structured prompt. Same model, different knowledge.
The implication for the long tail. The uncovered 90+ findings from Section 03 do not all need their own datasets. If you can describe what a finding looks like, drawing on radiology textbooks, training materials, or expert knowledge, you can potentially detect it. The economics shift from data annotation at scale to knowledge engineering. The competitive question shifts from "who has the most scans" to "who can best encode clinical reasoning that models can apply."
What this doesn't solve. This is a proof of concept on a single public case. Prompt engineering is fragile; small wording changes can break performance. We have not tested across the variability you would see in clinical practice (different scanners, patient populations, image quality). The notebook is reproducible, but the result is not yet generalizable.
The question is no longer if a language-guided VLM can reason about medical images. It is how reliably it can do so across the variability of real clinical settings.
⚠️ Disclaimer. This is a technical blog post sharing early experimental insights. It is not a peer-reviewed publication, not medical advice, and not a description of a clinical product. The models discussed are not intended for clinical diagnosis. All experiments were conducted on publicly available imaging datasets. Rigorous clinical validation and peer-reviewed results will be published separately. Code and cached experiment outputs are available in the companion notebook1.
Interested?
If this resonated, we'd love to hear from you.
Radiologists and researchers: If you have a workflow or an edge case you think could benefit from this approach, we'd love to collaborate on a case study.
References
- 1. Companion notebook for this blog post. GRAI / Medsee. Link ↩
- 2. U.S. Food and Drug Administration. (2025). Artificial Intelligence and Machine Learning (AI/ML)-Enabled Medical Devices. Link ↩
- 3. Bluemke, D.A., et al. (2020). "Assessing Radiology Research on Artificial Intelligence: A Brief Guide for Authors, Reviewers, and Readers—From the Radiology Editorial Board." Radiology, 294(3), 487-489. Link ↩
- 4. Allen, B., et al. (2021). "Evaluation and Real-world Performance Monitoring of Artificial Intelligence Models in Clinical Practice: Try It, Buy It, Check It." Journal of the American College of Radiology, 18(11), 1489-1496. Link ↩
- 5. Fardon, D.F., et al. (2014). "Lumbar disc nomenclature: version 2.0: Recommendations of the combined task forces of the North American Spine Society, the American Society of Spine Radiology and the American Society of Neuroradiology." Spine Journal, 14(11), 2525-2545. Link ↩
- 6. Langlotz, C.P. (2006). "RadLex: a new method for indexing online educational materials." Radiographics, 26(6), 1595-1597. Link ↩
- 7. Sobel, I., & Feldman, G. (1968). A 3×3 isotropic gradient operator for image processing. Stanford Artificial Intelligence Project (SAIL). ↩
- 8. Vizuara. Classical Filters and Convolution. Link
- 9. Othman, Z., Haron, H., & Abdul Kadir, M.R. (2009). "Comparison of Canny and Sobel Edge Detection in MRI Images." Proceedings of International Conference on Electrical Engineering and Informatics.
- 10. Chan, H.P., Doi, K., Vyborny, C.J., et al. (1990). "Computer-aided detection of microcalcifications in mammograms: Methodology and preliminary clinical study." Investigative Radiology, 25(10), 1102-1110. Link ↩
- 11. Karssemeijer, N., & te Brake, G.M. (1996). "Detection of stellate distortions in mammograms." IEEE Transactions on Medical Imaging, 15(5), 611-619. Link ↩
- 12. Krizhevsky, A., Sutskever, I., & Hinton, G.E. (2012). "ImageNet Classification with Deep Convolutional Neural Networks." Advances in Neural Information Processing Systems, 25 (NeurIPS 2012). ↩
- 13. Russakovsky, O., et al. (2015). "ImageNet Large Scale Visual Recognition Challenge." International Journal of Computer Vision, 115(3), 211-252. Link ↩
- 14. Zeiler, M.D., & Fergus, R. (2014). "Visualizing and Understanding Convolutional Networks." European Conference on Computer Vision (ECCV), 818-833. Link ↩
- 15. Kaka, H., Wu, J., Ranti, D., et al. (2025). "Real-world performance evaluation of a commercial deep learning model for intracranial hemorrhage detection." npj Digital Medicine, 8(1), 15. Link ↩
- 16. Digumarthy, S.R., et al. (2023). "Performance of a Chest Radiography AI Algorithm for Detection of Missed or Mislabeled Findings: A Multicenter Study." MDPI. Referenced in Qure.ai FDA clearance announcement, September 12, 2023. (96% sensitivity, 100% specificity for pneumothorax.) ↩
- 17. Qure.ai. (2026). "Qure.ai Secures Six New FDA Clearances for qXR-Detect." Press release, February 26, 2026. ↩
- 18. Raoof, S., et al. (2012). "Interpretation of Plain Chest Roentgenogram." CHEST, 141(2), 545-558. Link ↩
- 19. Jones, C.M., et al. (2021). "Effect of a comprehensive deep-learning model on the accuracy of chest x-ray interpretation by radiologists: a retrospective, multireader multicase study." The Lancet Digital Health, 3(7), e496-e506. Link ↩
- 20. Reed, J.C. (2003). Review: Chest Radiology: Plain Film Patterns and Differential Diagnoses, 5th Edition. American Journal of Roentgenology, 182(3), 558. Link ↩
- 21. Kanne, J.P., et al. (2015). "Back to Basics – 'Must Know' Classical Signs in Thoracic Radiology." Journal of Clinical Imaging Science, 5, 39. PMC4541161. ↩
- 22. Ross, J.S. (2023). "Vertebral Hemangioma." Radsource. Link ↩
- 23. Abul-Kasim, K., Persson, E., Levinsson, A., et al. (2023). "Vertebral Hemangiomas: Prevalence, new classification and natural history." Journal of Orthopaedic Surgery, 31(1), 10428. Link ↩
- 24. Thawkar, O., Shaker, A., Mullappilly, S.S., Cholakkal, H., Anwer, R.M., Khan, S., Laaksonen, J., & Khan, F.S. (2024). "XrayGPT: Chest Radiographs Summarization using Medical Vision-Language Models." BIONLP-ACL 2024. arXiv:2306.07971 ↩
- 25. Chen, Z., et al. (2025). "Constructing a Unified Vision-Language Model for Chest Radiograph-based Diagnostics, Medical Education, and Data Augmentation." Radiology: Cardiothoracic Imaging, 7(1). Link ↩
- 26. Liu, J., Hu, T., Xiong, H., Du, J., Feng, Y., Wu, J., Zhou, J.T., & Liu, Z. (2024). "VPL: Visual Proxy Learning Framework for Zero-Shot Medical Image Diagnosis." In Findings of the Association for Computational Linguistics: EMNLP 2024, pages 9978-9992. Link ↩
- 27. Zhou, Y., Ong, H., Kennedy, P., Wu, C.C., Kazam, J., Hentel, K., et al. (2024). "Evaluating GPT-4 with Vision on Detection of Radiologic Findings on Chest Radiographs." Radiology, 312(1), e233270. Link ↩
- 28. Strotzer, Q.D., Nieberle, F., Kupke, L.S., et al. (2024). "Toward Foundation Models in Radiology? Quantitative Assessment of GPT-4V's Multimodal and Multianatomic Region Capabilities." Radiology, 313(2), e240955. Link ↩
- 29. Pang, S., Du, A., Orgun, M.A., Wang, Y., Sheng, Q.Z., Wang, S., Huang, X., & Yu, Z. (2024). "A systematic review of few-shot learning in medical imaging." Artificial Intelligence Review, 57(8), 1-66. Link ↩
- 30. Shi, Y., et al. (2025). "Few-Shot Learning for Medical Image Segmentation: A Review and Comparative Study." ACM Computing Surveys, 58(1), 1-38. Link ↩
- 31. Laredo, J.D., Reizine, D., Bard, M., & Merland, J.J. (1990). "Vertebral hemangiomas: fat content as a sign of aggressiveness." Radiology, 177(2), 467-472. Link ↩
- 32. Pfirrmann, C.W., Metzdorf, A., Zanetti, M., Hodler, J., & Boos, N. (2001). "Magnetic resonance classification of lumbar intervertebral disc degeneration." Spine, 26(17), 1873-1878. Link ↩
- 33. Wei, J., Wang, X., Schuurmans, D., Bosma, M., Ichter, B., Xia, F., Chi, E., Le, Q., & Zhou, D. (2022). "Chain-of-Thought Prompting Elicits Reasoning in Large Language Models." Advances in Neural Information Processing Systems, 35 (NeurIPS 2022). arXiv:2201.11903 ↩
- 34. Radiopaedia. Vertebral haemangioma. Link ↩
- 35. Jones, S.E., et al. (2024). "Deep learning improves physician accuracy in the comprehensive detection of abnormalities on chest X-rays." Scientific Reports, 14, 25962. (FDA-cleared Chest-CAD system K210666 with 8 anatomic categories.) Link ↩
All articles